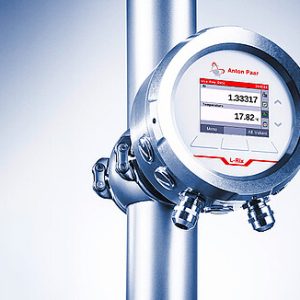
Inline Beverage analyzer: Beer Monitor 5500/5600
Key features
Two system configurations to suit your requirements
Beer Monitor 5500
Density and sound velocity sensor combined with a p/T (volume expansion) CO2 measurement
- Low maintenance – depending on the operating conditions maintenance is required on average every 6 to 18 months
- Product-specific setups at the best value
- W-shaped oscillating tube
- Digital signal processing
- New mechanical design for reduced size and weight
Beer Monitor 5600
Density and sound velocity sensor combined with an optical CO2 measurement
- Product-independent measurement (whatever your beverages’ solubility, sugar composition, foreign gases, color, or turbidity: nothing influences your readings)
- Suitable for hygienic applications
- Maintenance-free
- W-shaped oscillating tube
- Digital signal processing
- New mechanical design for reduced size and weight
Ensured product quality with additional beer-specific parameters
Apparent and real degree of fermentation, apparent extract, specific gravity, present gravity, calories, and real-extract-to-alcohol ratio are parameters that tell you whether the product quality meets the standard for each special beer style you run in your production line.
Rapid production start
Save time and costs during commissioning and production downtimes, and accommodate a wide range of beer styles with little or no adjustment. Anton Paar’s Beer Monitors are perfectly adapted to the market’s changing tastes, preferences, and requirements. They give you the flexibility to react to product and market demands instantly.
Fit for your production environment
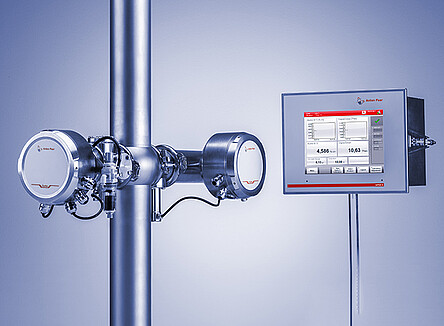
Equipped with an internal sample pump the Beer Monitors can be mounted directly in the line using both sides of the VARINLINE® access unit without further mounting support. This allows flexible installations even in lines with only a minimum of available space.
Ease of use
A simple touchscreen user interface facilitates the setup of the instrument and product parameters. In addition, you can visualize your process and display graphical trends with a just a few clicks. By setting lower and upper limits on measurement values, alarms can be set and triggered using digital or relay outputs.
Improved process capability – keeping an eye on all relevant key parameters
The powerful data acquisition and visualization software (client-server) Davis 5 enables you to save all data and alarms, provides statistical process control and graphical trend analysis, and allows product adjustments. Password-protected access to all measuring systems is possible from various locations, while providing powerful reporting and integration with your corporate quality management system.

